29+ Years
Serving Consumers
Within the Asia-Pacific region
| USDm | FY22 | FY23 | FY24 | CAGR FY22-24 |
|---|---|---|---|---|
| Revenue | 1,059 | 1,108 | 1,212 | 7.0% |
| Domestic | 1,021 | 1,066 | 1,161 | 6.7% |
| Seasonings | 347 | 410 | 439 | 12.6% |
| Convenience food | 305 | 331 | 362 | 9.0% |
| Beverage | 175 | 180 | 207 | 8.7% |
| Coffee | 57 | 64 | 69 | 10.2% |
| HPC | 52 | 72 | 75 | 20.1% |
| Others | 85 | 9 | 10 | n.m2 |
| Exports | 38 | 42 | 51 | 16.0% |
| Gross profit | 437 | 509 | 565 | 13.8% |
| EBITDA1 | 259 | 294 | 327 | 12.3% |
| EBIT1 | 224 | 266 | 298 | 15.2% |
| NPAT | 217 | 282 | 311 | 19.6% |
| PATMI | 214 | 278 | 306 | 19.6% |
| Revenue growth (% yoy) | 4.7% | 9.4% | ||
| %GPM | 41.3% | 45.9% | 46.6% | |
| %EBITDAM | 24.5% | 26.6% | 27.0% | |
| %EBITM | 21.2% | 24.0% | 24.6% | |
| %NPATM | 20.5% | 25.5% | 25.6% |
| Balance Sheet (USDm) | Dec’23 | Dec’24 |
|---|---|---|
| Assets | ||
| Cash and cash equivalents | 227 | 223 |
| Short-term investments | 193 | 14 |
| Short-term trade receivables | 42 | 40 |
| Inventories | 85 | 101 |
| Other ST assets | 391 | 29 |
| Total ST assets | 939 | 408 |
| Fixed assets | 218 | 206 |
| Other LT assets | 435 | 481 |
| Total LT assets | 653 | 687 |
| Liabilities | ||
| Short-term trade payables | 79 | 91 |
| Short-term borrowings | 332 | 356 |
| Long-term borrowings | 9 | 69 |
| Other liabilities | 136 | 134 |
| Total Liabilities | 556 | 650 |
| Equity | ||
| Owner’s Equity | 1,012 | 420 |
| Minority’s Interest | 23 | 25 |
| Total Equity | 1,035 | 444 |

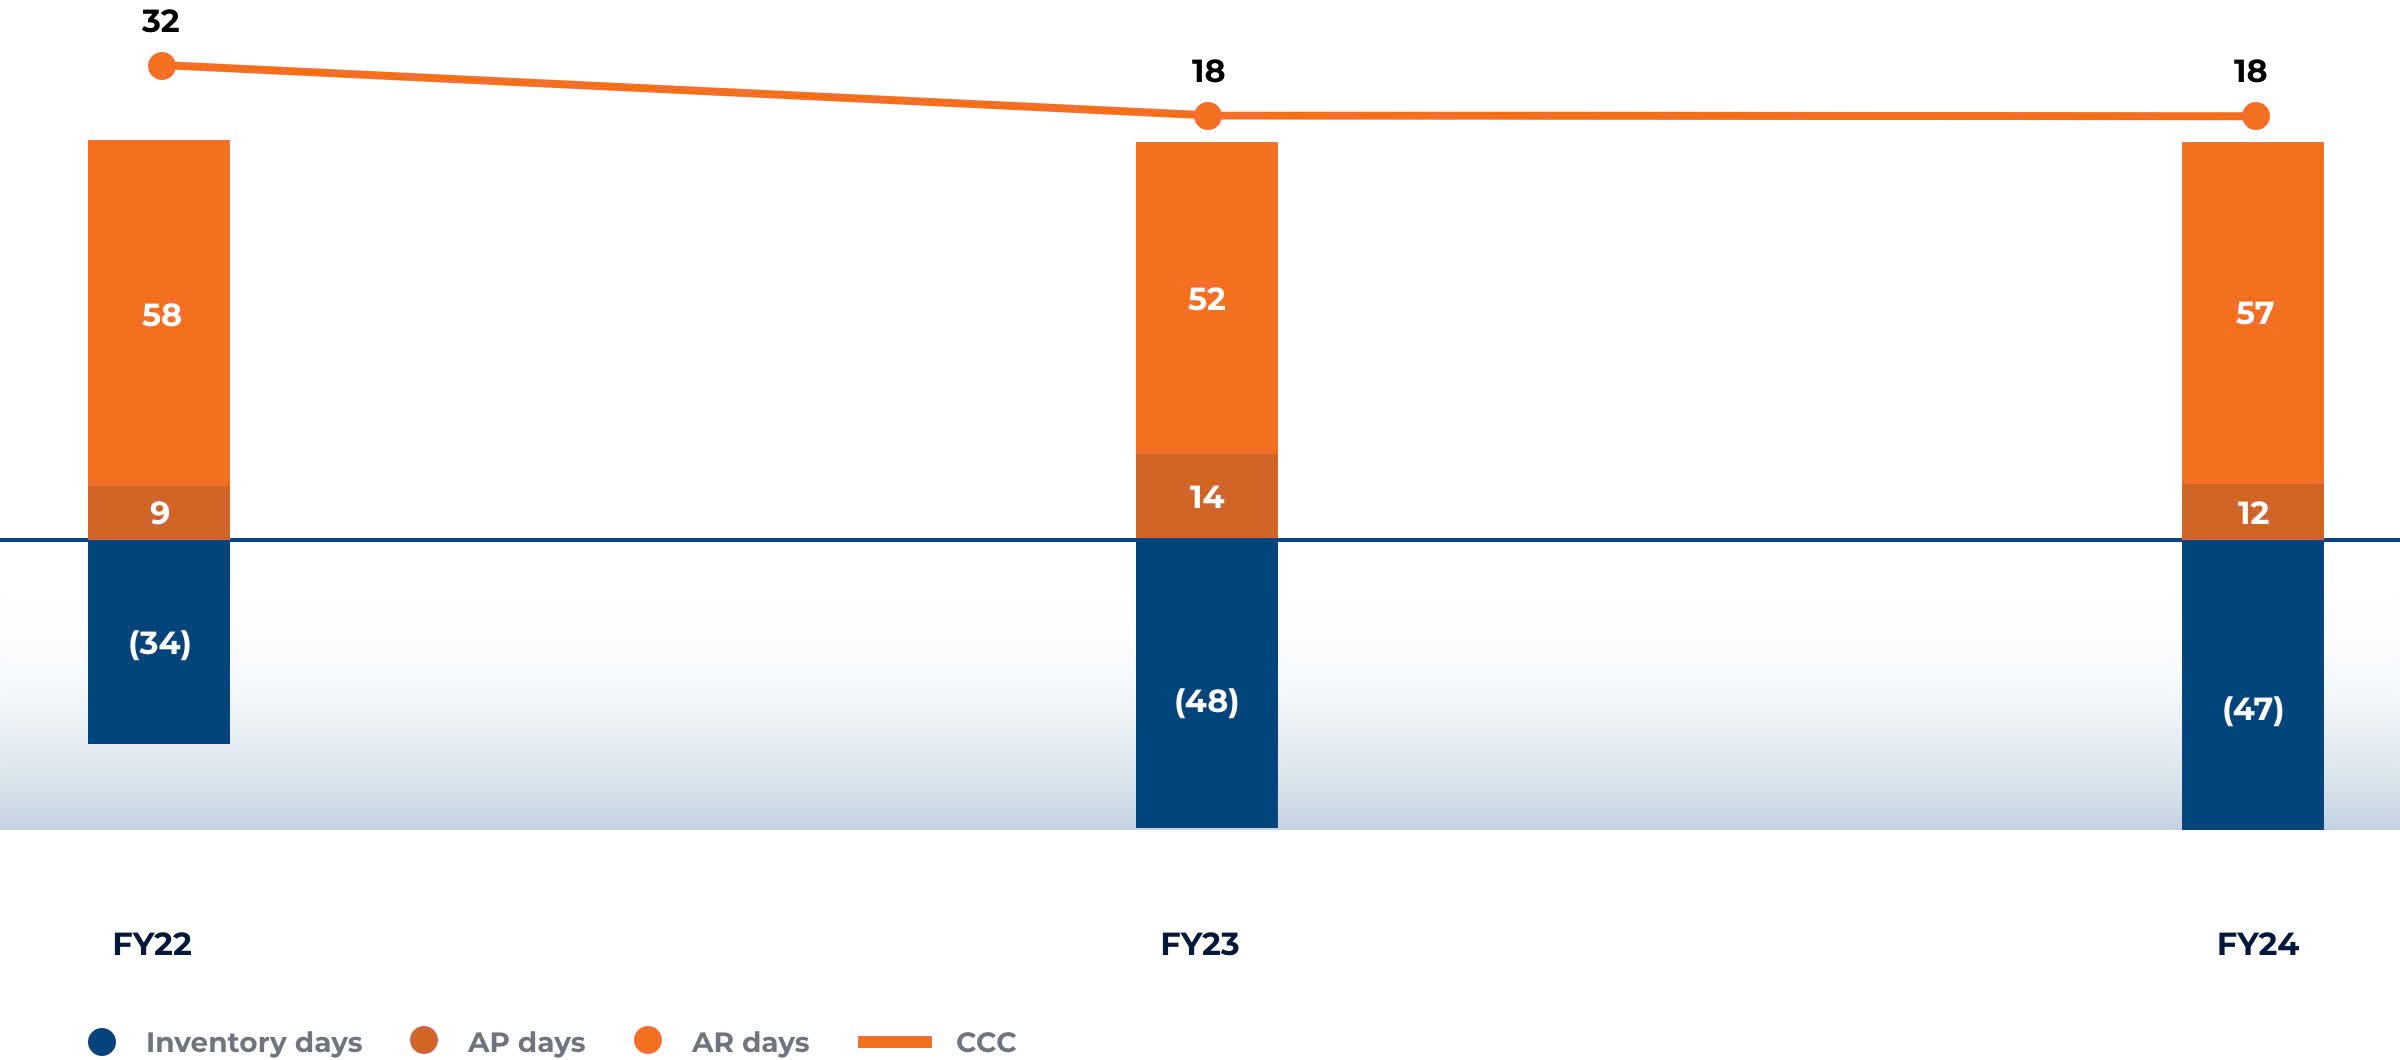
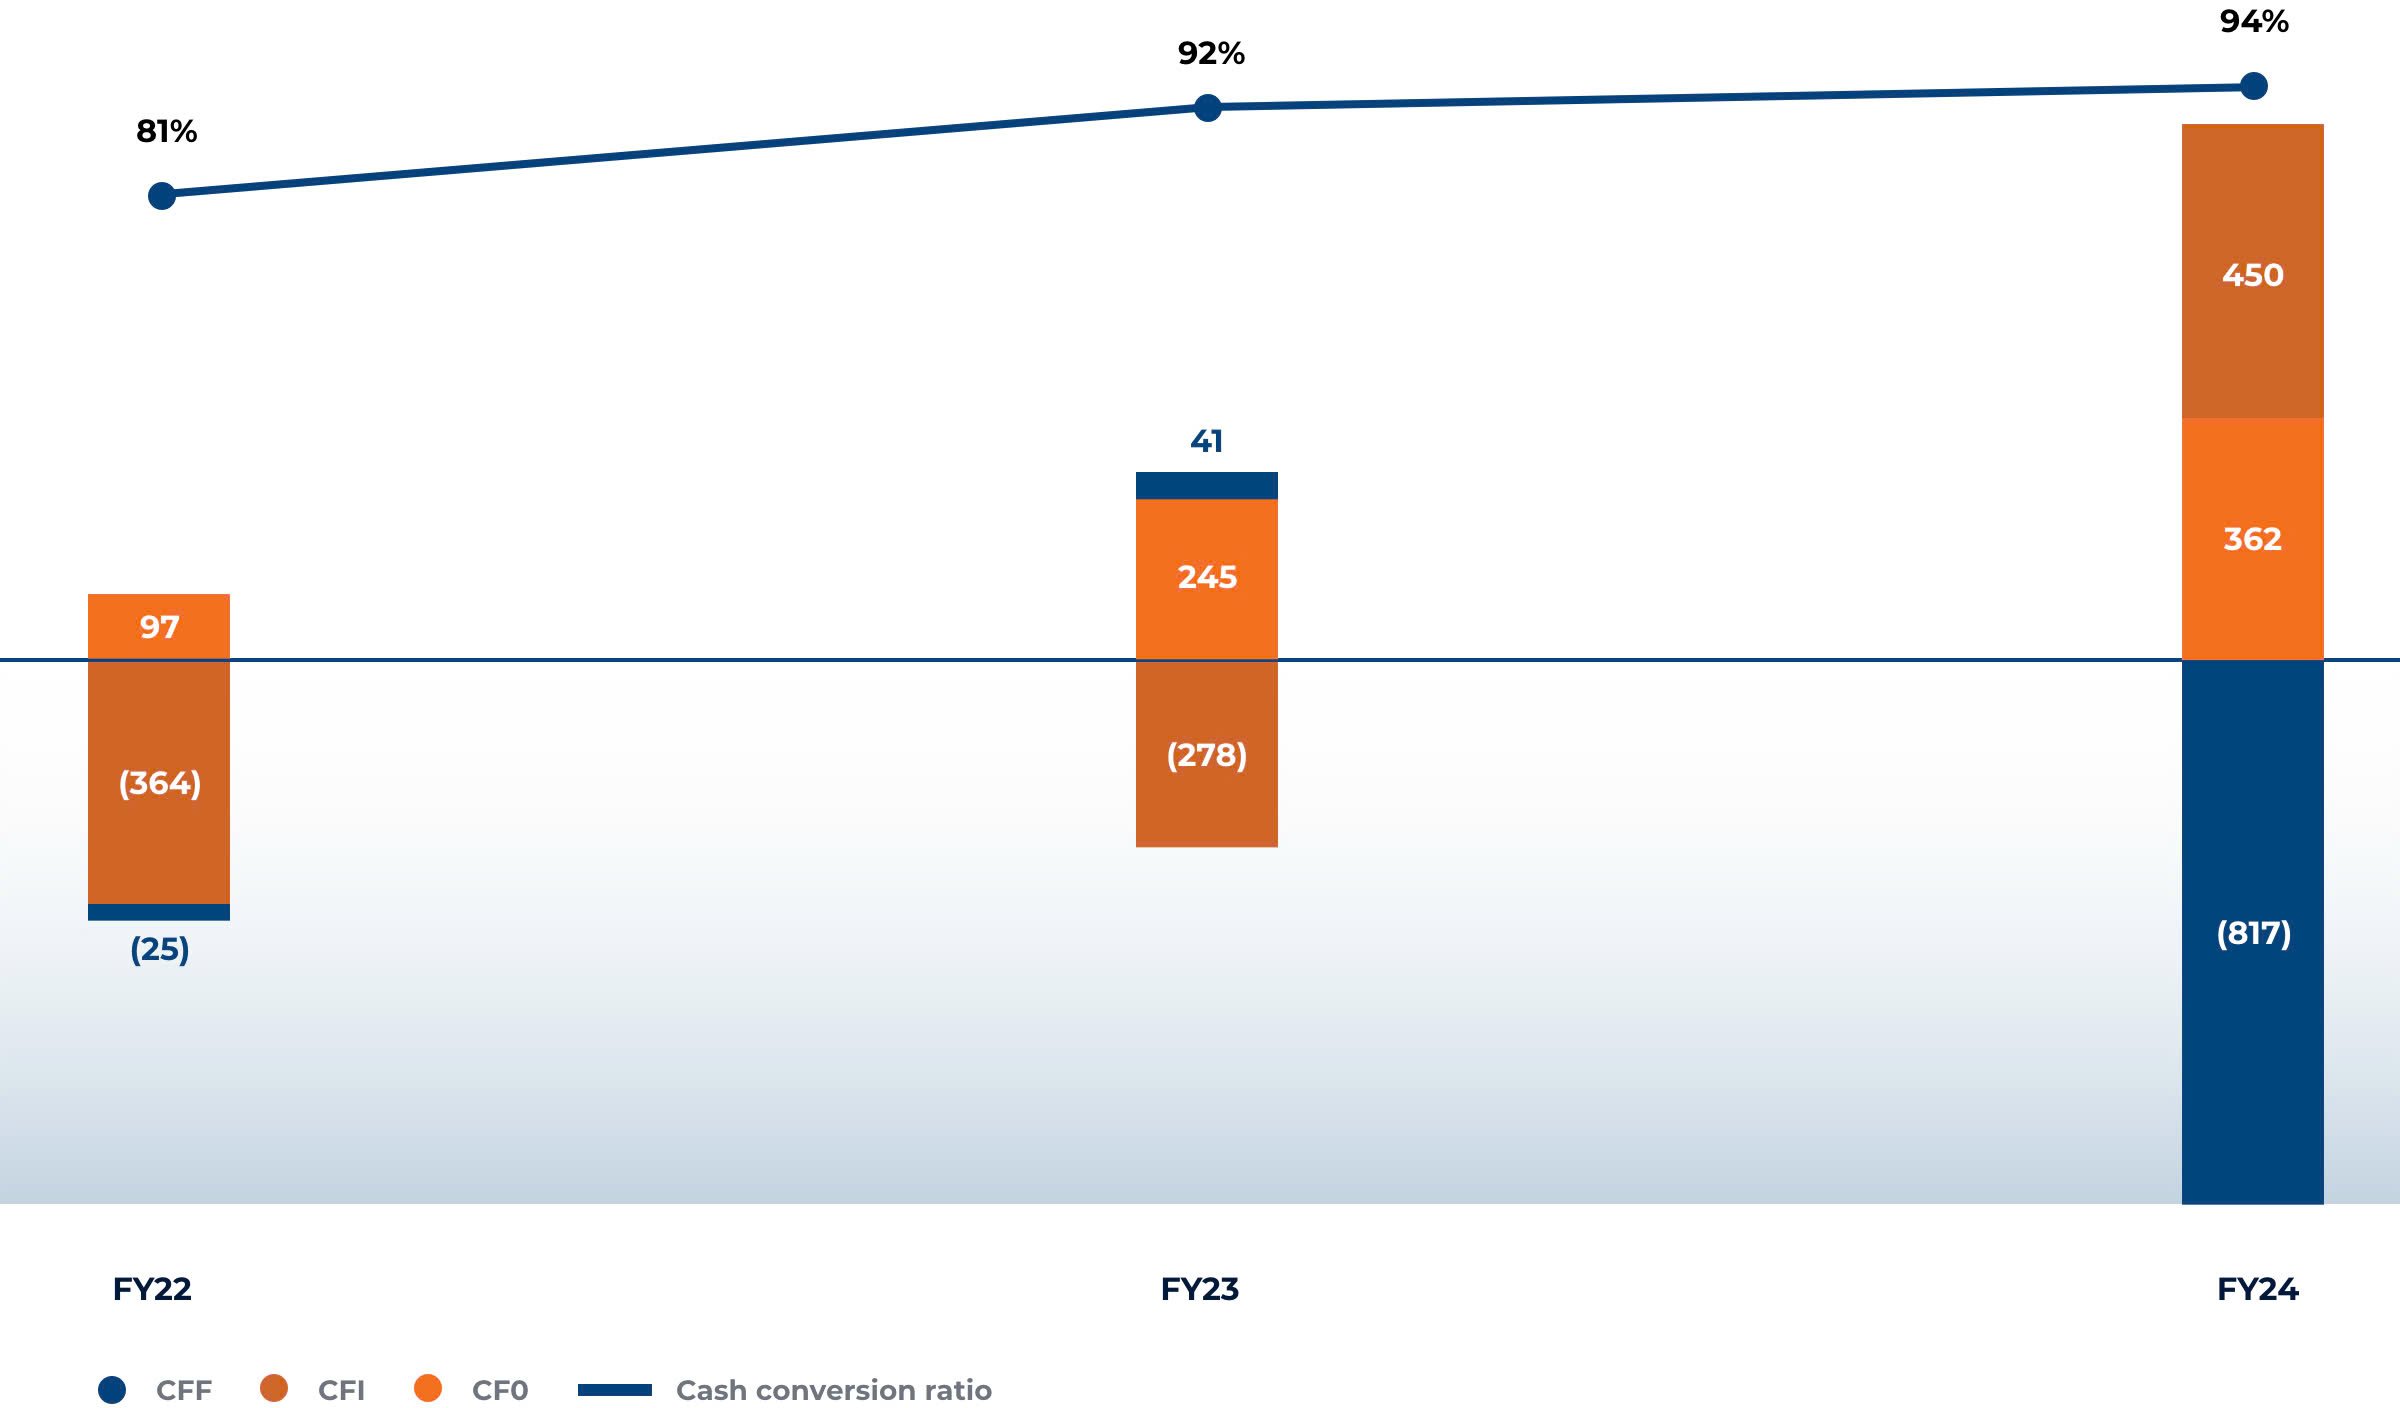
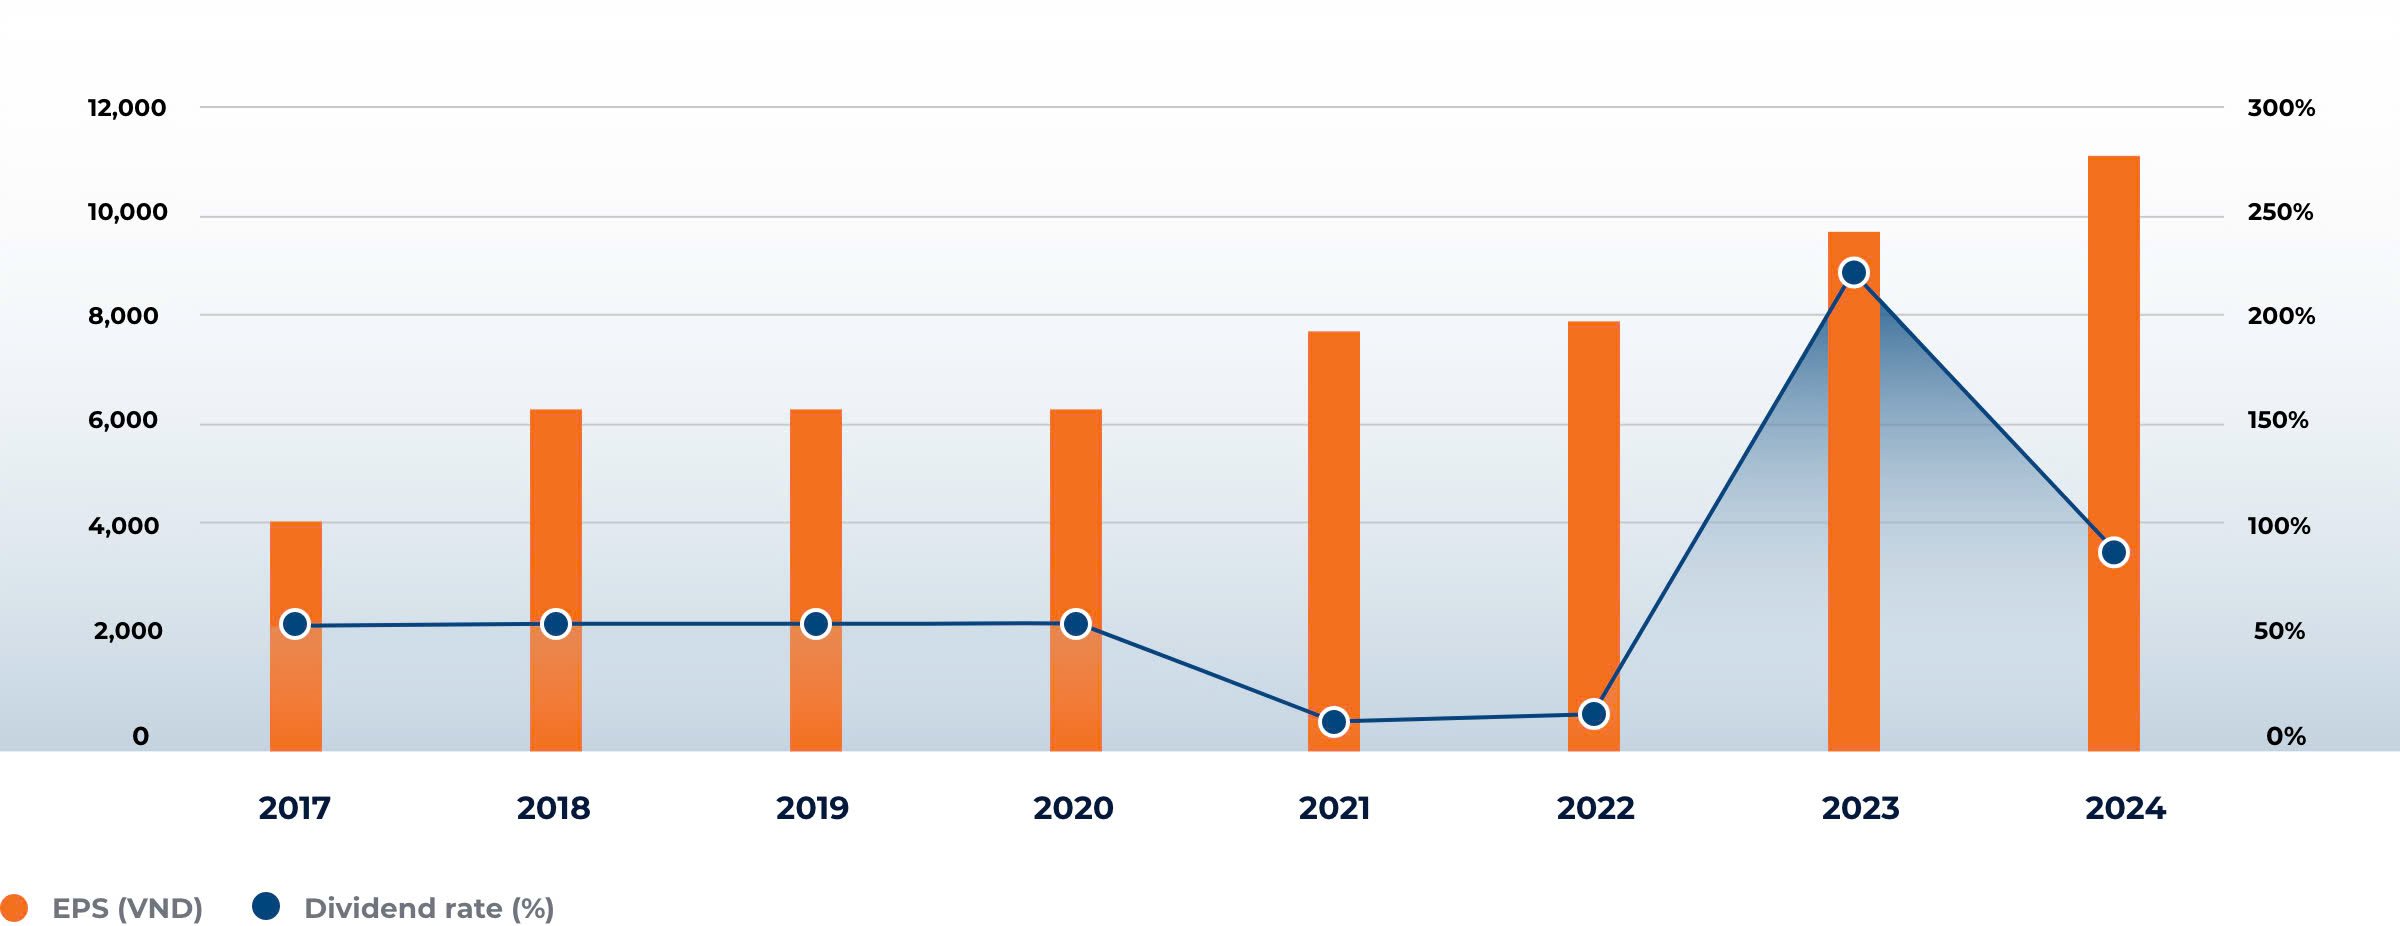
Net Debt/ EBITDA
as of Dec 2024